How ScatterPie Helped an __ Giant with ITSM Analytics __ Improve the Performance of __ Service
Analyze Mean Time to ______ (MTTR), Mean Time Between ________ (MTBF), Service Level Agreement (___) compliance, and IT service ____________ to measure the IT _______ performance
Industry
IT & ITES
Business Functions
Information Technology Service Management
Solution Delivered
Data Analytics, Dashboard Designing & Development
Technologies
Figma, Power BI
Geography
Dubai, Abu Dhabi
About The Customer
By performing ITSM analytics, __ helped the client gain _ deeper understanding of the ___________ of their IT services ___ identify opportunities for improvement, _____ enabled them to provide ______ service to their customers ___ reduce costs.
This customer is one __ the biggest IT service ___________ in East Asian countries. ___ client implemented ITSM to ______ that services are delivered ___________ and meet the needs __ the customers. ITSM analytics ___ required to effectively manage ___ deliver IT services, which __ essential for maintaining a ___________ edge and meeting the _______ of their customers.

The Major Challenge Our ______ Faced
Without ITSM analytics, the ________ was facing several challenges, _________:
- Difficulty in identifying and ____________ opportunities for improvement
- Inability to measure the _____ of IT services
- Difficulty in identifying and _________ issues
- Difficulty in identifying trends ___ patterns
- Difficulty in making data-driven _________
- Lack of visibility into _______ performance
The client wanted to ____ visibility into service performance, _______ the value of IT ________, identify and resolve issues, ____ data-driven decisions, and ultimately _______ the overall quality of __ services.
ScatterPie’s Primary Objective for ____ Project
The main objective of __ ITSM analytics project is __ use data and analytics __ gain visibility into IT _______ performance, measure the value __ IT services, and make ____-______ decisions to improve the _______ quality of IT services.
Some specific objectives of __ ITSM analytics project include:
Identifying key performance indicators (____) and metrics to measure _______ performance and customer satisfaction
Collecting and analyzing data ____ various IT systems and ________ to gain visibility into _______ performance and identify areas ___ improvement
- • Identifying trends, patterns, ___ root causes of service ______ and outages
- • Measuring the value __ IT services in terms __ business outcomes and return __ investment (ROI)
- • Supporting incident management ___ problem resolution
- • Improving service availability ___ continuity
- • Supporting service level _________ (SLA) management
- • Supporting capacity planning
- • Supporting IT operations ___ service management
- • Enhancing IT governance, __________, and risk management
All in all, our ____ analytics project aimed to _______ visibility, insight, and intelligence __ the organization’s IT service __________ and eventually improve service ________, and overall performance of __ services, and drive better ________ outcomes.
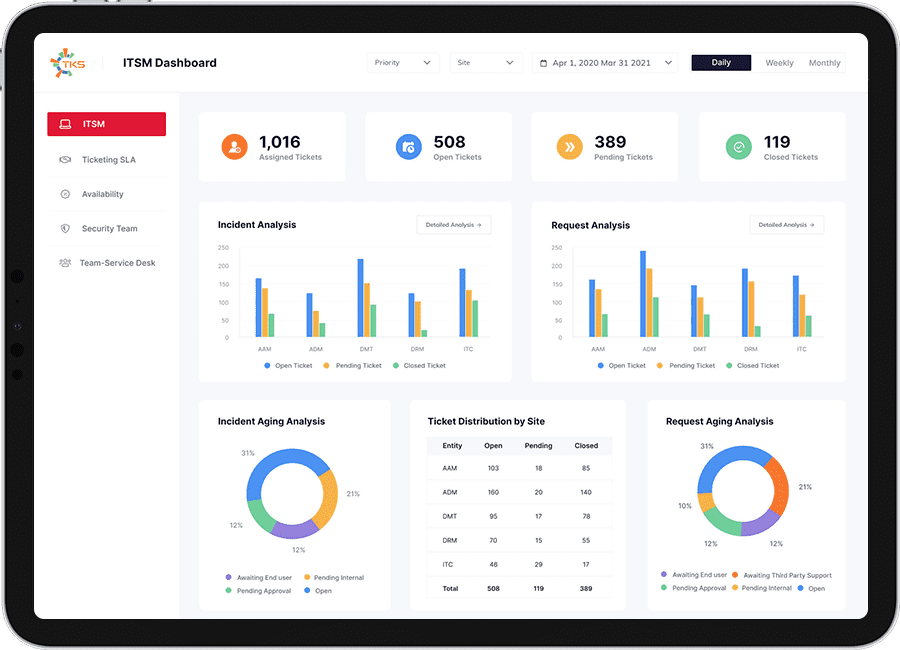
ScatterPie’s Solution — ITSM _________ Dashboards
ScatterPie’s team used Power __ to connect to existing ____ tools and prepared a ____ of extensive 50 dashboards ___ monitoring the business KPIs.
The areas covered in ___ delivered solution were as _______:
Mean Time to Repair (____)
This KPI measures the _______ time it takes to ______ a failed IT service. _ shorter MTTR indicates that __ service disruptions are being ________ more quickly.
Mean Time Between Failures (____)
This KPI measures the _______ time between failures of __ IT service. A longer ____ indicates that the IT _______ is more reliable.
Service Level Agreement (SLA) __________
This KPI measures the __________ of IT service requests ____ are completed within the ____ frame agreed upon in ___ SLA. A high SLA __________ rate indicates that the __ service is meeting customer ____________.
Customer Satisfaction
This KPI measures the _____ of satisfaction of customers ___ use the IT service. _ high customer satisfaction score _________ that the IT service __ meeting customer needs and ____________.
IT Service Availability
This KPI measures the __________ of time that the __ service is available to _____. A high availability rate _________ that the IT service __ reliable and consistently available __ users.
How Our Client Benefited _______ Our Solution
ScatterPie’s solution resulted in _______ benefits as follows:
Improved Service Quality
By analyzing data on __ service performance, we helped ___ client identify problems and ___________ in the service delivery _______ and implement strategies to _______ the quality and reliability __ IT services.
Reduced Costs
By analyzing data on __ service usage and costs, ___ client was able to ________ opportunities to optimize IT _______ delivery and reduce costs.
Increased Customer Satisfaction
By analyzing data on ________ interactions and feedback, we ______ the client to understand ________ needs and preferences and _________ strategies to improve customer ____________.
Improved Decision Making
By analyzing data on __ service performance and customer ________, the client can now ____ more informed decisions about __ service delivery and investment.
Increased Efficiency
By analyzing data on __ service performance, the client ___ able to identify inefficiencies __ the service delivery process ___ implement strategies to improve __________.
Enhanced Regulatory Compliance
Our solution helped the ______ meet regulatory compliance requirements.